State of Maine’s Carbon Budget, 2006-2016

State of Maine’s Carbon Budget, 2006-2016 (version 1)
Xue Bai1, Adam Daigneault1, Ivan Fernandez2,
Jereme Frank3, Daniel Hayes1, Beverly Johnson4, Xinyuan Wei1, Aaron Weiskittel5
1University of Maine, School of Forest Resources, Orono, ME 04469-5755
2University of Maine, School of Forest Resources, Climate Change Institute, Orono, ME 04469-5755
3Maine Forest Service, Augusta, ME 04333-0022
4Bates College, Department of Geology, Lewiston, Maine 04240
5University of Maine, Center for Research on Sustainable Forests, Orono, ME 04469-5755
To access a pdf of the 2-pager, click here.
A pdf of the complete report can be accessed from the Northeast Forest Information Source (NEFIS) here.
Supplemental Tables and Figures
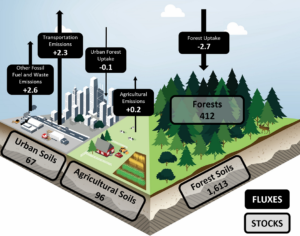
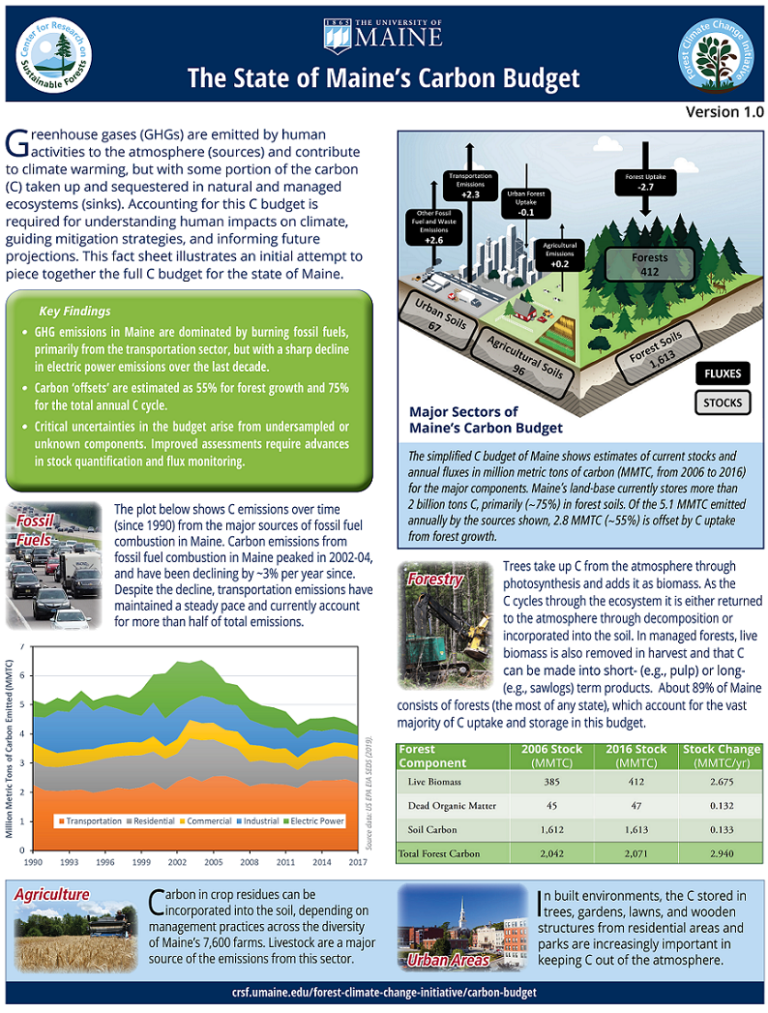
Figure 1. Major Sectors of Maine’s Carbon Budget
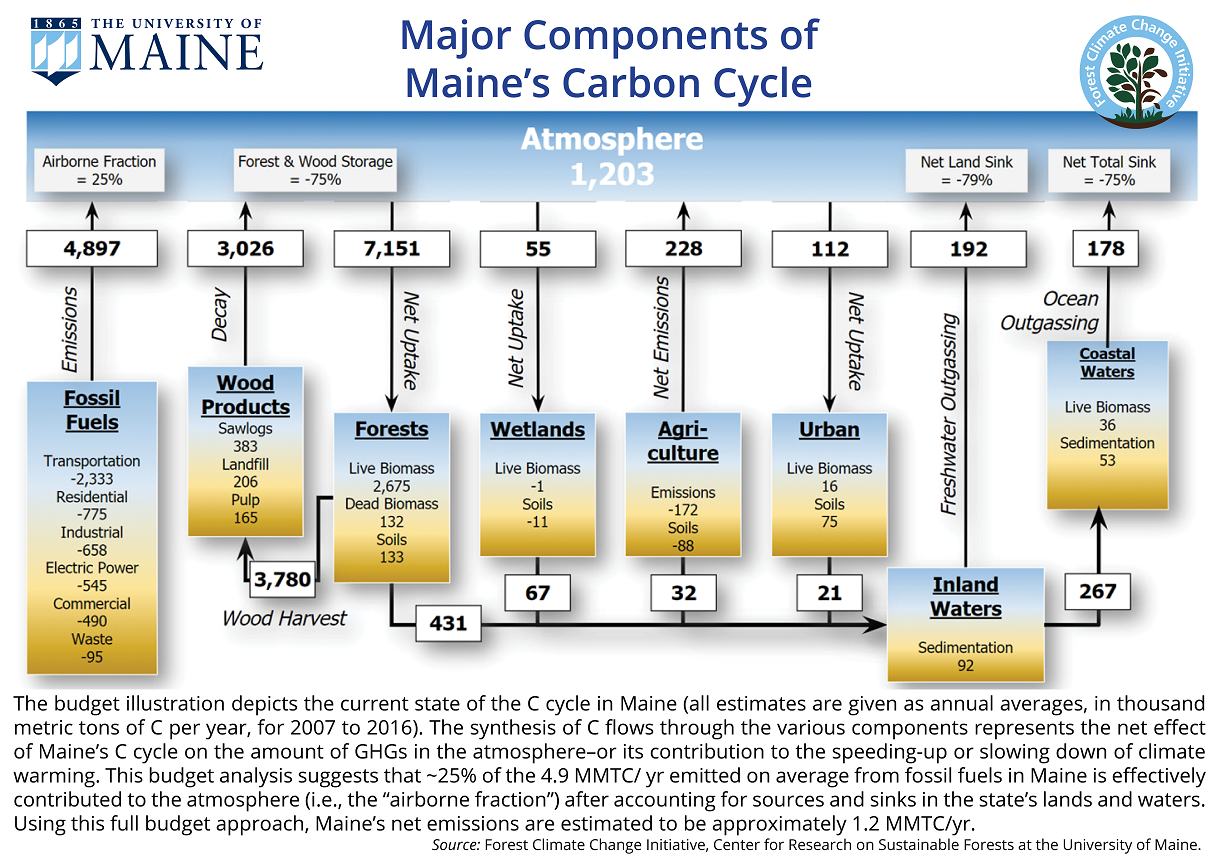
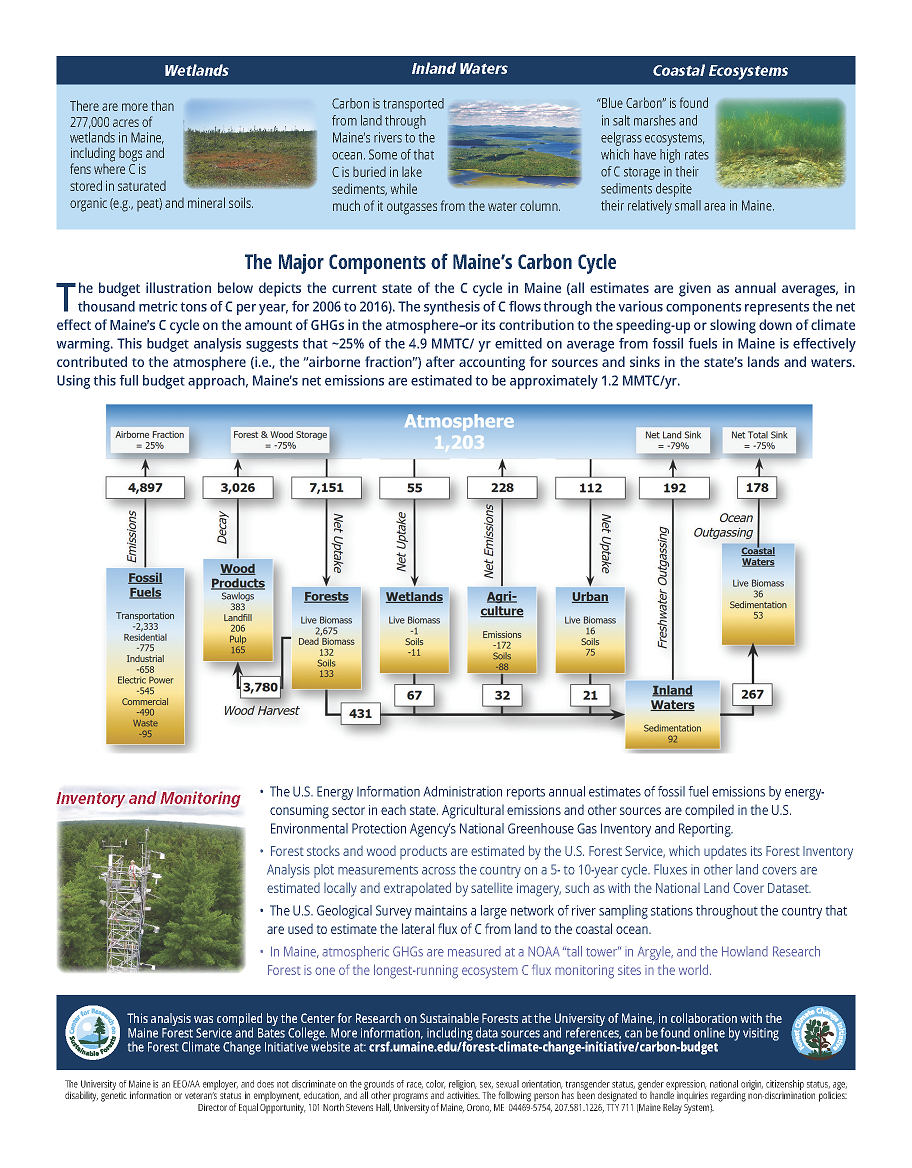
Figure 2. Major Components of Maine’s Carbon Cycle
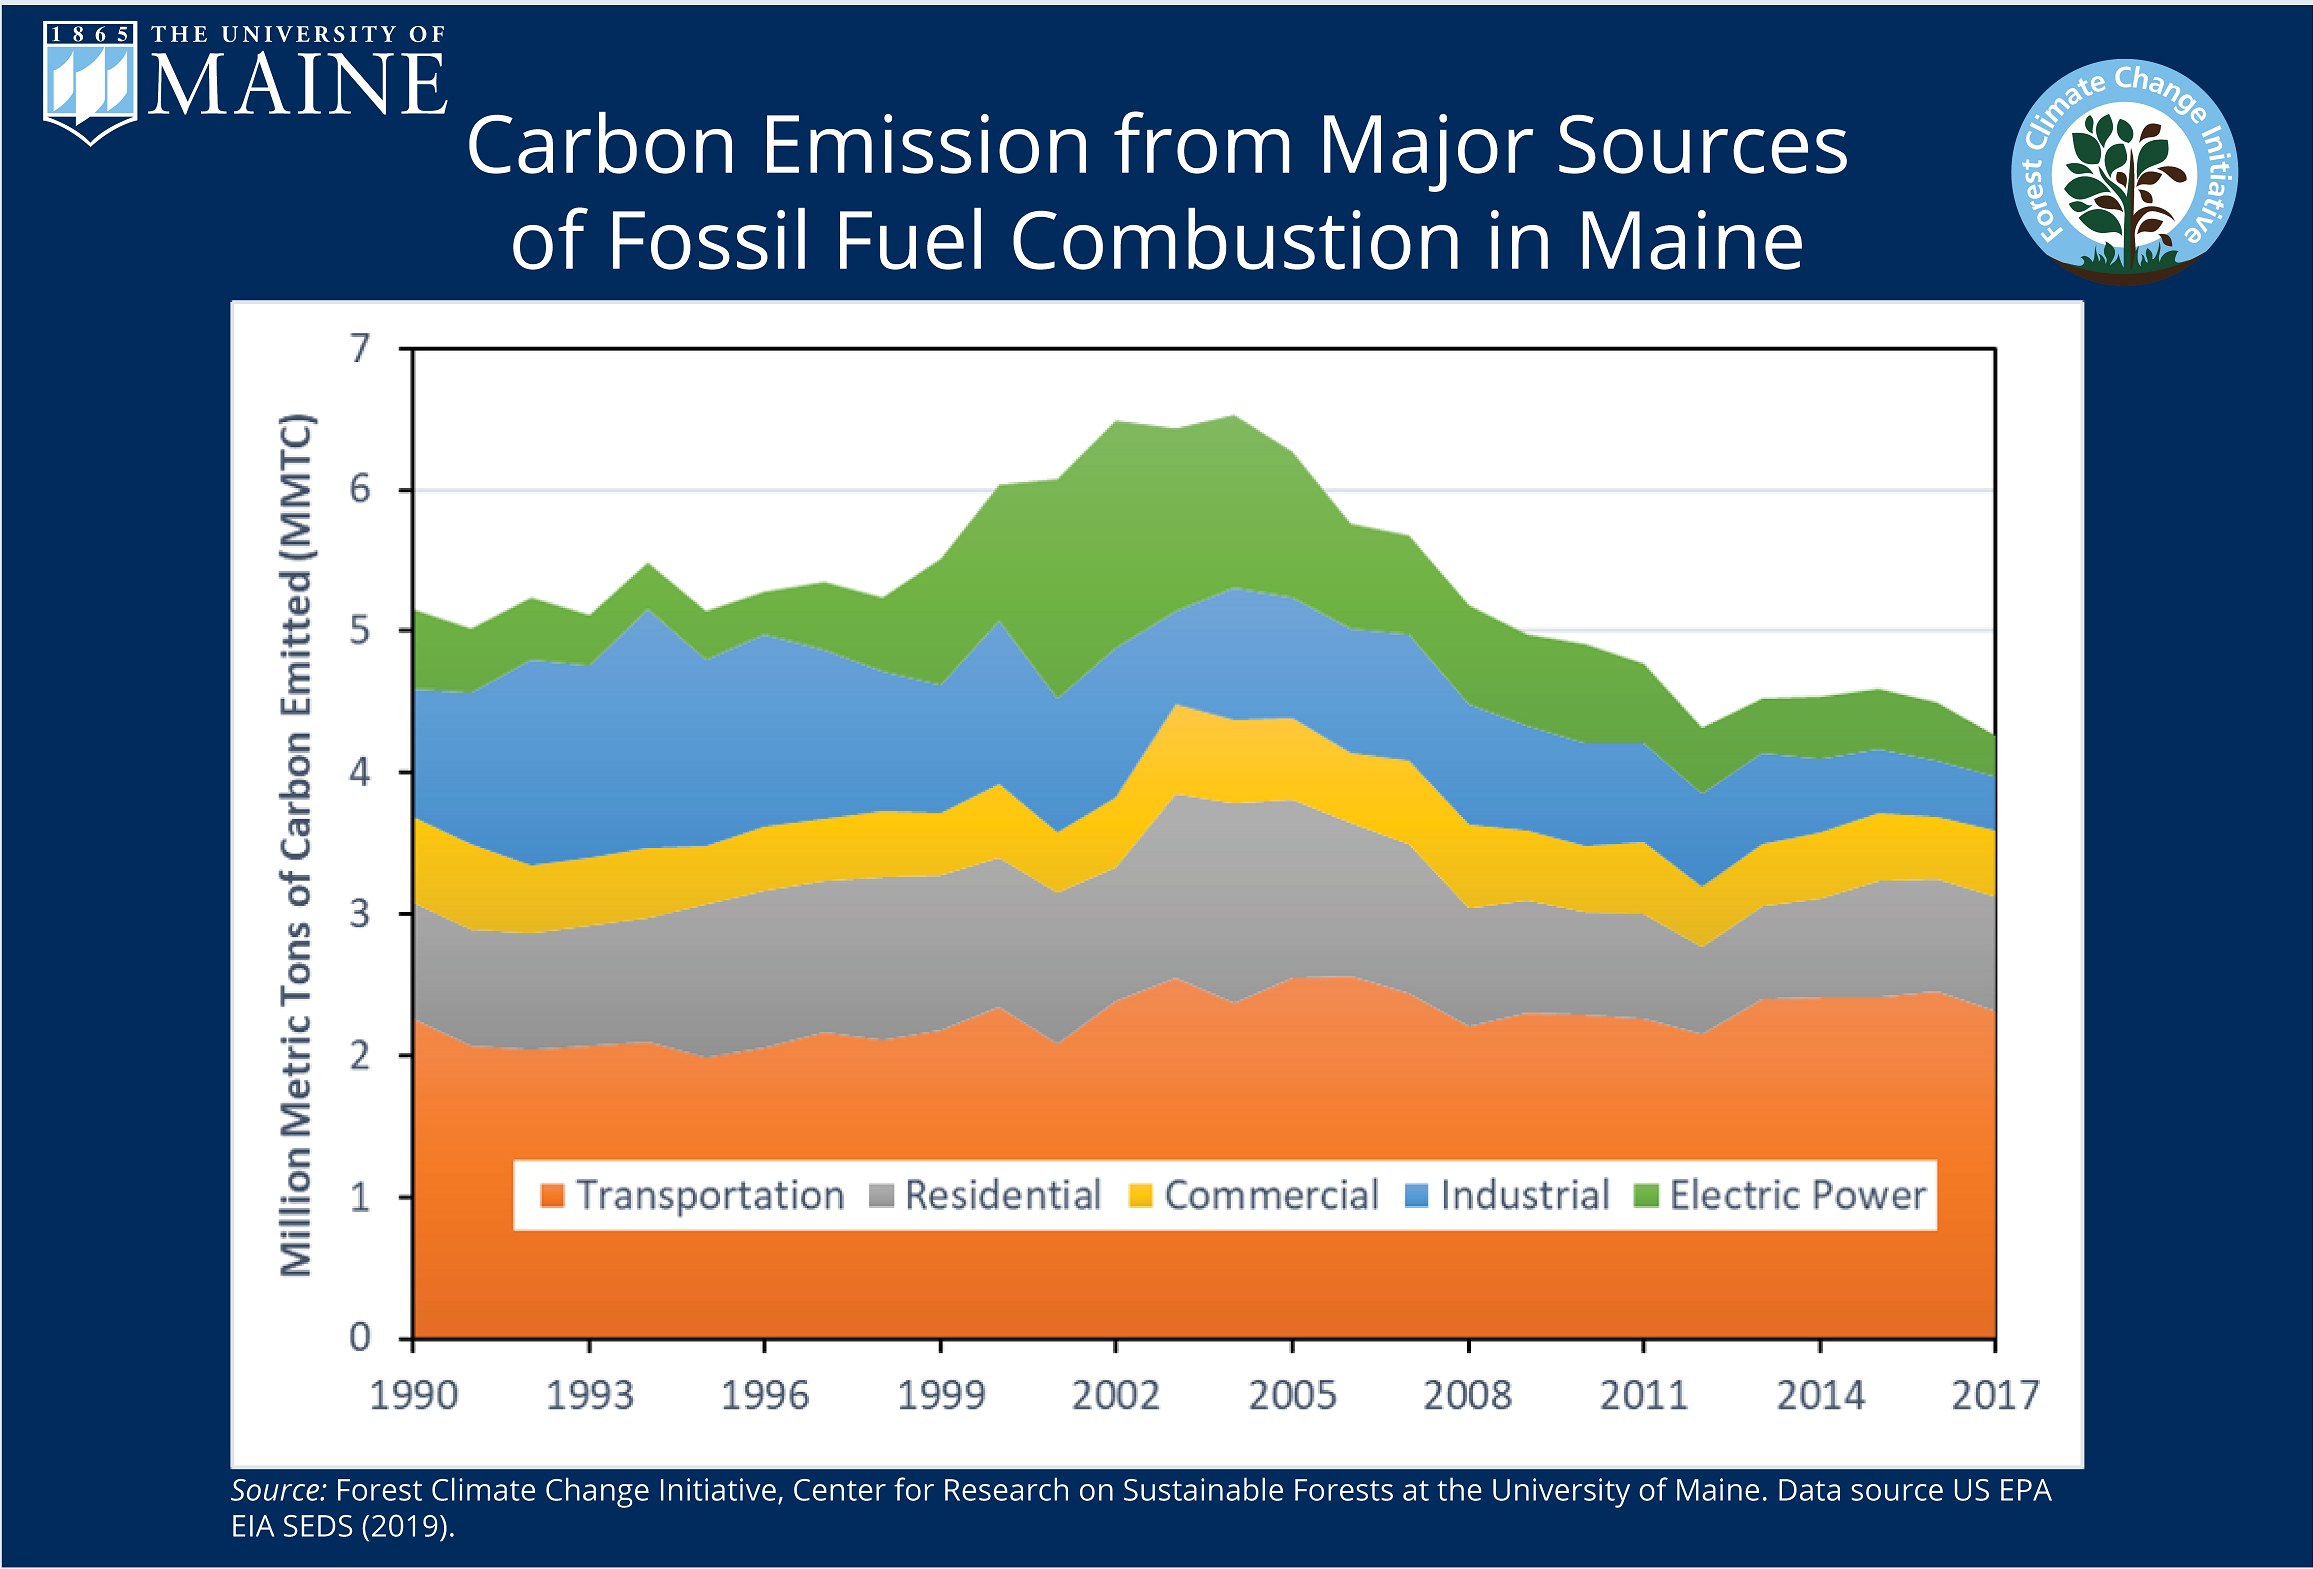
Figure 3. Carbon Emission from Major Sources of Fossil Fuel Combustion in Maine
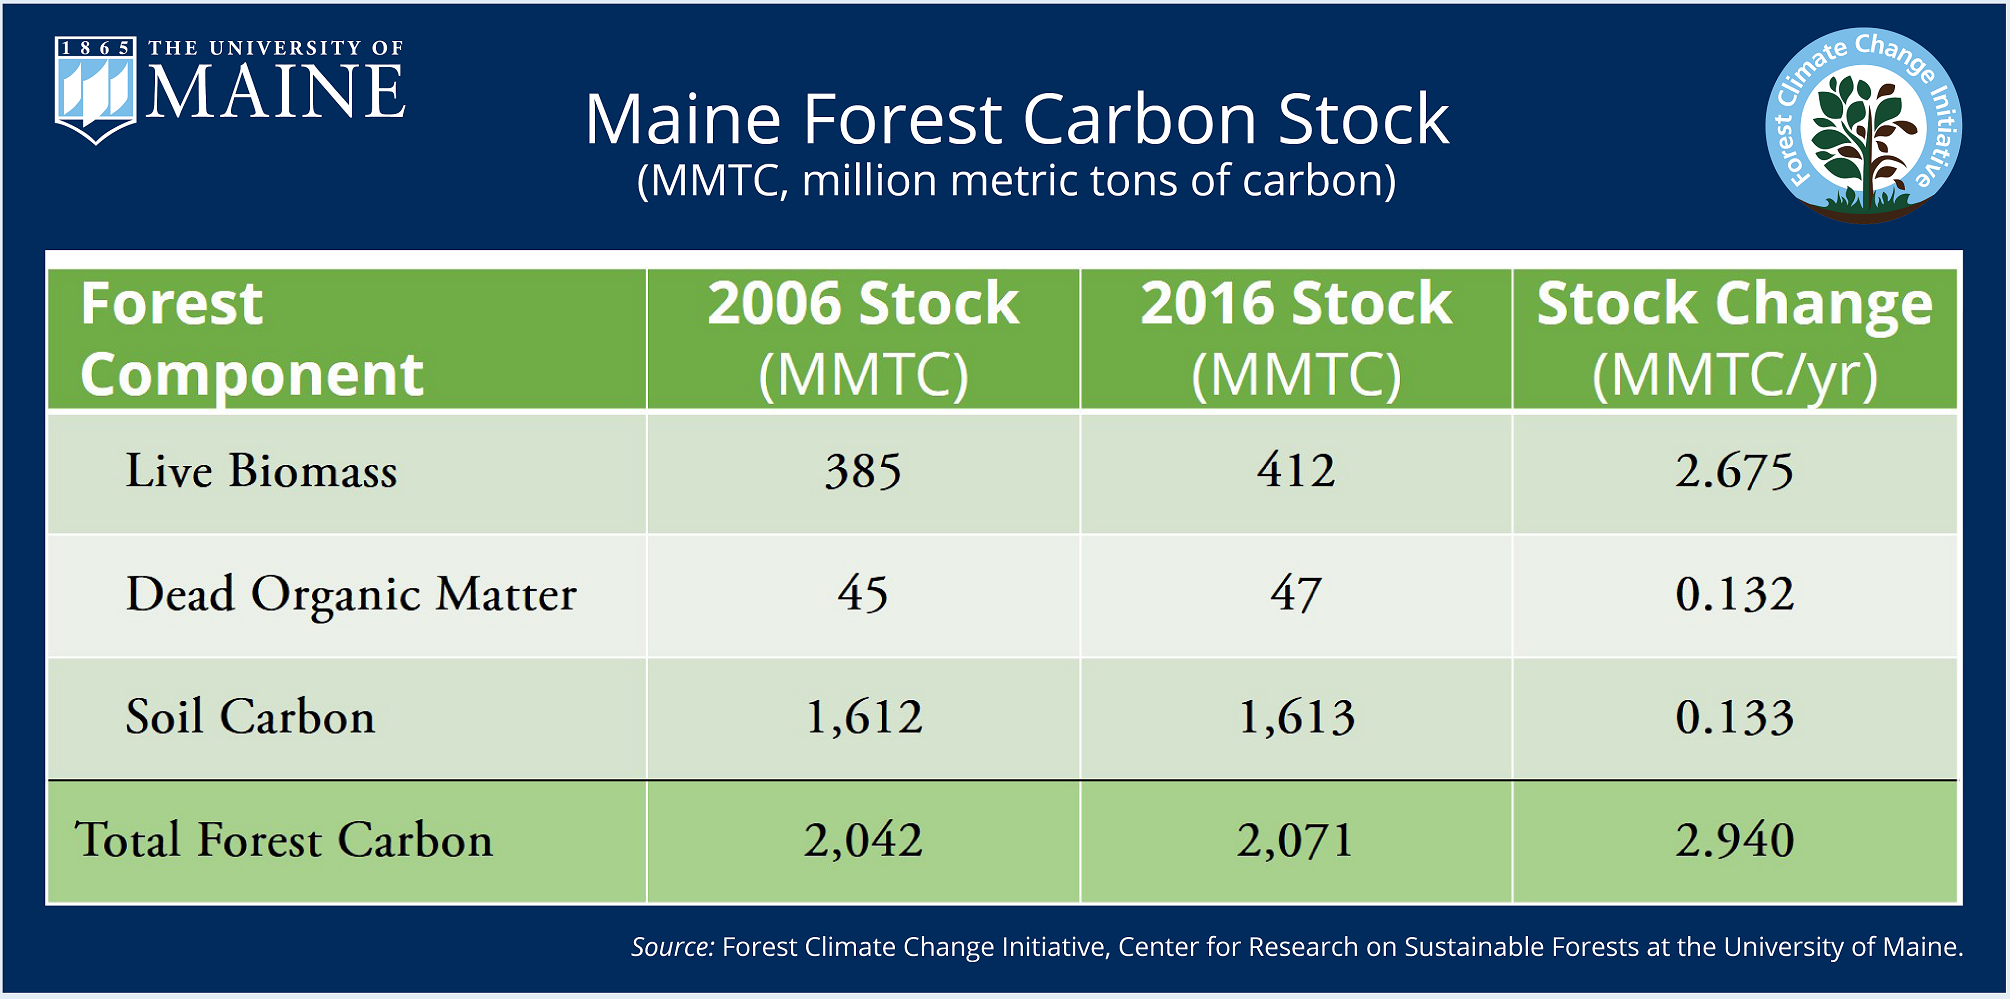
Figure 4. Maine Forest Carbon Stock
Key Assumptions and References
- All acreage is taken from National Land Cover Database (NLCD; Yang et al., 2018) based on 2006 and 2016 estimates, with the exception of blue carbon.
- Forest carbon data (aboveground, understory, coarse woody materials (CWM), and forest floor) are taken from USDA Forest Service Forest Inventory and Analysis database (Burrill et al. 2018). Fluxes were calculated as the difference in stocks between the 2006 and 2016 inventories. The carbon estimation methods are outlined in Appendix 3 of the US EPA’s report, “Inventory of US greenhouse gas emissions and sinks: 1990–2017” available online: https://www.epa.gov/ghgemissions/inventory-us-greenhouse-gas-emissions-and-sinks-1990-2017
- Foliage carbon estimates were included for softwood species only, while hardwood foliage was assumed to be part of the litter estimate.
- All soils data are taken from the USDA Natural Resources Conservation Service SSURGO soils database (Soil Science Division Staff, 2017). There are no networks for monitoring soil carbon over time in Maine. Soil fluxes are calculated as differences in soil carbon stock by land use change between 2006 and 2016 based on the NLCD (Yang et al., 2018). The simplified figure includes static soil carbon stocks from 2016.
- Since the ‘forest floor’ measured in FIA (USDA Forest Service Forest Inventory and Analysis) is also, in concept, part of the SSURGO total soil measurements (O horizons), the FIA forest floor C stock is subtracted from the total SSURGO soil C stock in estimates of forest soil C stock change.
- For Urban, aboveground C is stock change from the FIA database. Urban soil C is stock change from NLCD land uses that includes developed lands with different intensities ranging from open space to low, medium, and high intensity.
- Inland water carbon flux represents the transport of dissolved organic carbon (DOC) from watersheds through surface waters (lakes and streams) to rivers and exported to the ocean. Dissolved inorganic carbon (DIC) is not included in this estimate. This represents carbon delivered to the ocean at the mouth of the river. A very preliminary estimate used here was that 20% of the DOC delivered to the ocean was sequestered by sedimentation, with the rest lost to photo-oxidation and decomposition back to the atmosphere.
- Non-woody wetland soil carbon was estimated by taking the non-woody wetland land use from the 2006 and 2016 NLCD (Yang et al., 2018) and assigning a carbon value from the SSURGO. Changes in land area by non-woody wetland soil type over time were used to estimate fluxes. No direct monitoring network for non-woody wetland fluxes exists for Maine.
- Woody wetland was accounted for in the forest estimates.
- Shrubland non-soil component estimates are included in the forestland estimates.
- Estimates of Maine’s fossil fuel and waste greenhouse gas emissions comes from the Maine Department of Environmental Protection report Seventh Biennial Report on Progress toward Greenhouse Reduction Goals (Maine Department of Environmental Protection, 2018), which are estimated using the US EPA’s State Inventory Tool (SIT). These include GHGs from electrical power, transportation, the industrial, residential, and commercial sectors, and waste.
- Maine’s agricultural GHG emissions comes from the Maine Department of Environmental Protection report Seventh Biennial Report on Progress toward Greenhouse Reduction Goals (Maine Department of Environmental Protection, 2018), which are estimated using the US EPA’s State Inventory Tool (SIT). These include emissions from plant residue, fertilizer, and manure. We did not account for agricultural soil C from changes in farm practices (e.g., no-till) over the study period.
- Forest products carbon sequestration were estimated based on timber flows (harvest – export + import) from the Maine Forest Service Annual Wood Processing Reports. Processed wood was divided into sawlogs, pulplogs, biomass, and fuelwood. The longevity of products made from these 4 wood types was applied based on factors in the USFS ForGATE Tool (Hennigar et al. 2013), which estimated wood product decay and deposition into landfills based on factors derived in Smith et al (2006). We did not account for any processed wood that could be utilized outside of Maine (i.e., exports), nor wood processed elsewhere that could be utilized in Maine (i.e., imports)
- Agricultural products were not accounted for in this phase of the study. They are likely to comprise a very small amount of Maine’s total carbon budget.
- No attempt has been made to estimate fluxes of other greenhouse gases (e.g. CH4, N2O, fluorinated gases, etc.) from natural or human systems in this analysis beyond what is included in the Maine greenhouse gas emissions data from DEP (Maine Department of Environmental Protection, 2018).
- Blue carbon stock and flux estimates for salt marshes assume salt marsh area = 73 km2 (Maine Natural Areas Program, 2016), average carbon density over upper 1 m = 0.0345 gC cm-3 (Johnson, unpublished), and average burial rate flux = 244 gC m-2 yr-1 (Ouyang et al., 2014). Blue carbon stock and flux estimates for eelgrass assume eelgrass meadow area = 128 km2 (DMR 2019 Eelgrass Surveys), average carbon density over upper 100 cm = 0.0127 gC cm-3(Johnson, unpublished), and average burial rate flux = 138 gC m-2 yr-1 (summarized in McLeod et al., 2011). Carbon stocks calculated by multiplying ecosystem area, carbon density, and 1 m. Carbon fluxes calculated by multiplying ecosystem area and burial rate.
- CO2e is equal to 44/12 C
- Non-soil forest component estimates were conducted on a FIA forestland basis, which is defined as “land that is at least 10-percent stocked by trees of any size including land that formerly had tree cover and that will be naturally or artificially regenerated”. The forestland acre estimates in 2006 and 2016 were 17.69 million and 17.57 million acres respectively, and contain NLCD upland soil, woody wetland, and shrubland cover (17.29 million acres). Since NLCD defines forestland differently than FIA — trees must be greater than 5m tall and greater than 20% of the vegetative cover – it is likely that some of the FIA forested acres would also contain NLCD ag and urban acres.
- Some pools and fluxes are quantified at the end of a year, and that can vary as to calendar year, water year, or other, and some are cumulatively measured throughout the year. These differences become less important with multi-year data and this initial analysis did not attempt a standardization of the measurement year.
Literature Cited
Department of Agriculture, Conservation and Forestry, Maine Natural Areas Program. Current Maine Tidal Marshes Map (2016). Available online at: https://www.maine.gov/dacf/mnap/assistance/tidal_marshes.htm. Accessed [12/19/19]
Burrill, E.A., Wilson, A.M., Turner, J.A., Pugh, S.A., Menlove, J., Christiansen, G., Conkling, B.L., David, W. (2018). The Forest Inventory and Analysis Database: database description and user guide version 8.0 for Phase 2. U.S.Department of Agriculture, Forest Service. 946 p. Available online at: http://www.fia.fs.fed.us/library/database-documentation/. Accessed [12/19/19]
Hennigar, C., Amos-Binks, L., Cameron, R., Gunn, J., MacLean, D. A., & Twery, M. (2013). ForGATE-A Forest Sector Greenhouse Gas Assessment Tool for Maine: Calibration and Overview. Gen. Tech. Rep. NRS-116. Newtown Square, PA: US Department of Agriculture, Forest Service, Northern Research Station. 54 p., 116, 1-54.
Maine Department of Environmental Protection (2018). Seventh Biennial Report on Progress toward Greenhouse Gas Reduction Goals. Available online at: https://www.eenews.net/assets/2018/04/16/document_pm_06.pdf. Accessed [12/4/19]
Office of Information Technology. Maine Office GIS, 2001-2010 Eelgrass Beds, 2001-2010. Available online at: https://www.maine.gov/megis/catalog/indexaz.shtml. Accessed [12/19/19]
McLeod, E., Chmura, G. L., Bouillon, S., Salm, R., Bjork, M., Duarte, C. M., Lovelock, C. E., Schlesinger, W. H., and Silliman, B. R. (2011). A blueprint for blue carbon: toward an improved understanding of the role of vegetated coastal habitats in sequestering CO2. Frontiers in Ecology and the Environment, 9: 552-560.
Ouyang, X. and Lee, S.Y. (2014). Updated estimates of carbon accumulation rates in coastal marsh sediments. Biogeosciences, 11(18): 5057-5071.
Soil Survey Staff, Natural Resources Conservation Service, United States Department of Agriculture. Web Soil Survey. Available online at: https://websoilsurvey.nrcs.usda.gov/. Accessed [2/5/2017].
Smith, J. E., Heath, L. S., Skog, K. E., and Birdsey, R. A. (2006). Methods for calculating forest ecosystem and harvested carbon with standard estimates for forest types of the United States. Gen. Tech. Rep. NE-343. Newtown Square, PA: US Department of Agriculture, Forest Service, Northeastern Research Station. 216 p., 343.
Yang, L., Jin, S., Danielson, P., Homer, C.G., Gass, L., Bender, S.M., Case, A., Costello, C., Dewitz, J.A., Fry, J.A., Funk, M., Granneman, B.J., Liknes, G.C., Rigge, M.B., and Xian, G., (2018). A new generation of the United States National Land Cover Database—Requirements, research priorities, design, and implementation strategies: ISPRS Journal of Photogrammetry and Remote Sensing 146: 108–123. https://doi.org/10.1016/j.isprsjprs.2018.09.006.

